


Filters

Stock vector images of Demografie
Discover royalty-free, professionally-designed vector art of Demografie for personal and commercial use.

Population and Demography, Illustration Set of 5 Types of Population Pyramids Chart or Age Structure Graph on Old Antique Vintage Grunge Paper Texture Background.

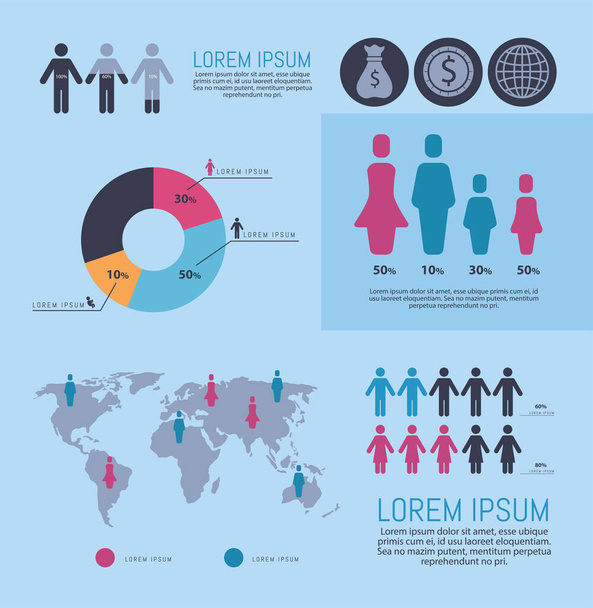
Human infographics. Vector template.

Of the world over grunge background vector illustration

Generation Z Landing Page Template Set. Zoomers Characters Virtual Messaging. New Modern Demography Trend with Progressive Youth Gen. Online Technology Influence. Cartoon People Vector Illustration

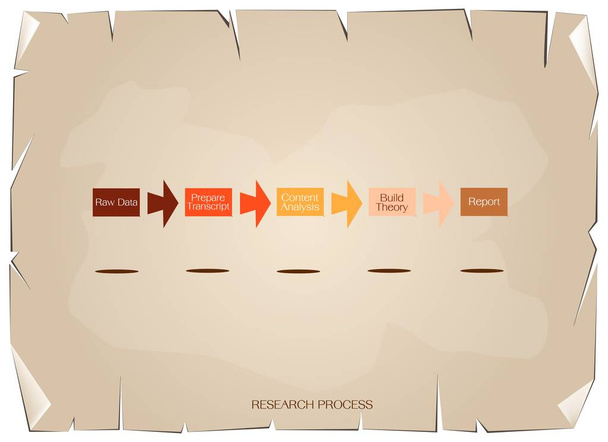
Business and Marketing or Social Research Process, Six Step of Qualitative and Quantitative Research Methods on Old Antique Vintage Grunge Paper Texture Background.
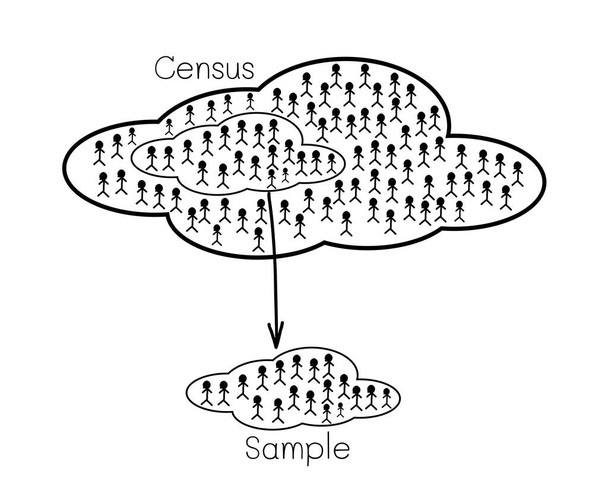
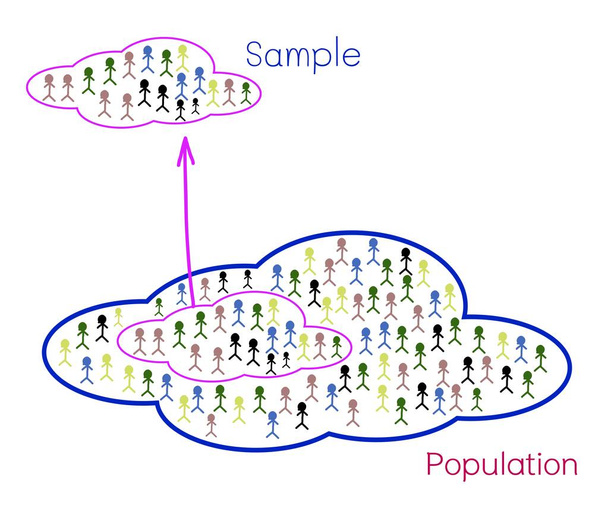
Business and Marketing or Social Research, The Process of Selecting Sample of Elements From Target Population to Conduct A Survey

Research Process and Methods, Type of Research From Application, Objectives and Information Sought

Eternal life - will we ever achieve biological endless existence. Is it possible be immortal

Illustration of crowding in a high street of a big city

Earth population statistics charts isolated on white background. Planet model and statistic data with discription vector illustration. Colorful graphics and diagrams for presentation visualization.

Flat illustration of large group of people. People opinion concept design

Business and Marketing or Social Research Process, Set of The Sampling Methods of Selecting Sample of Elements From Target Population to Conduct A Survey.

Demography Infographics. Vector template.

Demography growth concept with flat style people icons vector illustration.
Info graphics, business presentation vector on white background

Vector population Syria map. Demography mosaic of Syria map done of humans with different positions. Demographic map in blue hues. Abstract social representation of nation public cartography.

Vector population Qatar map. Demography mosaic of Qatar map done of people with different positions. Demographic map in blue tints. Abstract social representation of nation group cartography.

Vector population Ivory Coast map. Demography composition of Ivory Coast map designed of men with different poses. Demographic map in blue shades. Abstract social plan of nation group cartography.

Vector population European Union map. Demography composition of European Union map made of humans with variable positions. Demographic map in blue tinges.
Family conceptual emblem. Vector logo with silhouettes of men and women and child.

The word STATS concept written in colorful abstract typography. Vector EPS 10 available.

Population South African Republic map. Demography vector collage of South African Republic map organized of randomized people elements and small dots.

Population Sumatra Island map. Demography vector abstraction of Sumatra Island map made of scattered man elements and spheric dots. Abstract social plan of national audience cartography.

Population Arizona State map. Demography vector composition of Arizona State map done of person items. Abstract social scheme of national mass cartography. Demographic map in blue color hues.

Demography world continent map people. Population vector cartography collage of world continent map done of crowd items. Social plan of national community. Demographic abstract halftone map.

Population and Demography, Illustration of Hand Pointing Population Pyramids Chart or Age Structure Graph with Baby Boomers Generation, Gen X, Gen Y and Gen Z in 2016 to 2020.

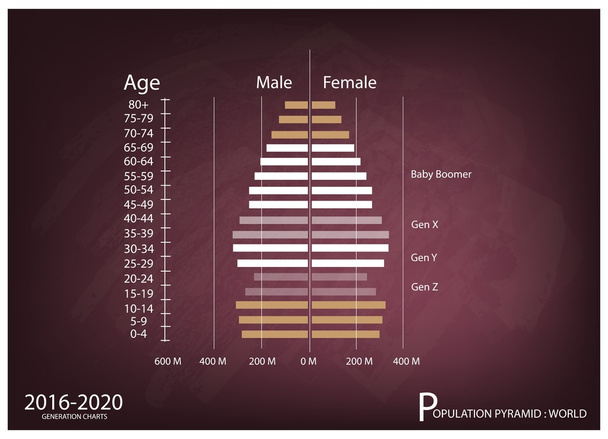
Population and Demography, Population Pyramids Chart or Age Structure Graph with Baby Boomers Generation, Gen X, Gen Y and Gen Z in 2016 to 2020 on Old Antique Vintage Grunge Paper Texture Background.

Business and Marketing or Social Research Process, The Sampling Methods of Selecting Sample of Elements From Target Population to Conduct A Survey on Old Antique Vintage Grunge Paper Background.

Business and Marketing or Social Research Process, 8 Step of Research Methods on Old Antique Vintage Grunge Paper Texture Background

Population and Demography, Illustration Paper Art Craft of Detail of Population Pyramid Charts or Age Structure Graphs.

Business and Marketing or Research Process, Classification of Sampling Methods The Probability and Non-Probability Sampling in Qualitative Research on Old Antique Vintage Grunge Paper Background.

Business and Marketing or Social Research Process, Six Step of Research Methods on Black Chalkboard.

Research Process and Methods, Type of Research From Application, Objectives and Information Sought on Chalkboard

Business and Marketing or Social Research Process, Illustration of The Process of Selecting Sample of Elements From Target Population to Conduct A Survey on Green Chalkboard.

Statistics, charts and graphs. Infographic simple flat elements and symbols for your design.
Vector doodle diagram icon. Chart with columns of different size.

Population Falkland Islands map. Demography vector mosaic of Falkland Islands map combined of person items. Abstract social representation of national group cartography.

Population Louisiana State map. Demography vector pattern of Louisiana State map designed of people items. Abstract social plan of nation community cartography. Demographic map in blue color tinges.

Population Mauritius Island map. Demography vector concept of Mauritius Island map done of man elements. Abstract social scheme of national group cartography. Demographic map in blue color shades.
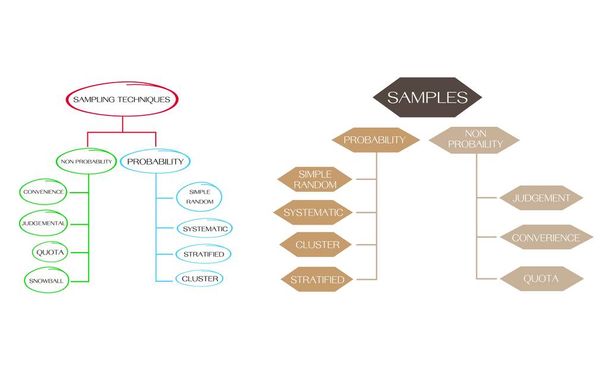
Business and Marketing or Social Research Process, Classification of Sampling Methods The Probability and Non-Probability Sampling in Qualitative Research.

Business and Marketing or Social Research Process, Six Step of Research Methods on Black Chalkboard

Business and Marketing or Social Research Process, 5 Step of Research Methods on Chalkboar

Business and Marketing or Social Research Process, Type of The Non-Probability Sampling Method in Qualitative Research

Business and Marketing or Social Research Process, 11 Step of Qualitative Research Methods.

Population and Demography, Illustration of Detail of Population Pyramids Chart or Age Structure Graph on Chalkboard Background.

Business and Marketing or Social Research, The Process of Selecting Sample of Elements From Target Population to Conduct A Survey

Business and Marketing or Social Research Process, The Sampling Methods of Selecting Sample of Elements From Target Population to Conduct A Survey.

Population and Demography, Illustration of Population Pyramids Chart or Age Structure Graph with Baby Boomers Generation, Gen X, Gen Y and Gen Z
Pictogram diagram icon. Black icon on white background.
Set Of 25 Universal Editable Icons. Can Be Used For Web, Mobile And App Design. Includes Elements Such As Computing Problems, Air Transport, Dialogue And More.
Set Of 16 Administration Icons. Includes Decision Making, Group Organization, Presentation Date And Other Symbols. Beautiful Design Elements.
Set Of 9 Board Icons. Includes Opinion Analysis, Group Organization, Personal Character And Other Symbols. Beautiful Design Elements.

Business and Marketing or Social Research Process, The Sampling Methods of Selecting Sample of Elements From Target Population to Conduct A Survey on Old Antique Vintage Grunge Paper Background.

Tiny people messaging online flat vector illustration

Human resources personnel analysis concept Changing the HR Landscape for Sustainable Business Success Driven by insights and focused on goals, processes, goals, skills and career opportunities.

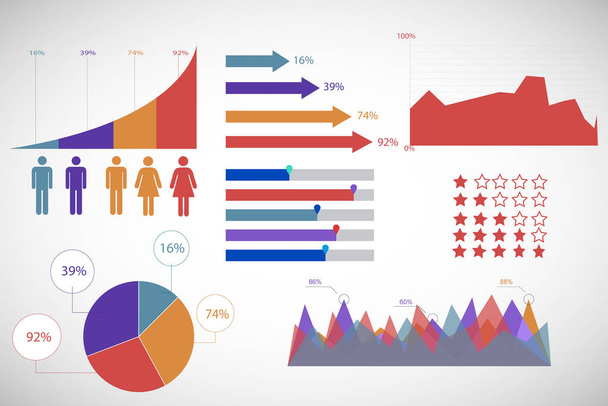
Human population demography percentage infographic. Infographics coloured differently depending of percentage vector illustration. Population percentage groups. Presentation demography

Population and Demography, Illustration Set of 5 Types of Population Pyramids Chart or Age Structure Graph Isolated on White Background

Population and Demography, Population Pyramids Chart or Age Structure Graph with Baby Boomers Generation, Gen X, Gen Y and Gen Z in 2016 to 2020

Population and Demography, Illustration of 4 Types of Population Pyramids Chart or Age Structure Graph Isolated on White Background

Business and Marketing or Social Research, The Process of Selecting Sample of Elements From Target Population to Conduct A Survey

Business and Marketing or Social Research Process, The Sampling Methods of Selecting Sample of Elements From Target Population to Conduct A Survey

Business and Marketing or Social Research Process, 6 Step of Qualitative and Quantitative Research Methods Isolated on White Background
Demography researcher line icon vector. demography researcher sign. isolated contour symbol black illustration

Population and Demography, Population Pyramids Chart or Age Structure Graph with Baby Boomers Generation, Gen X, Gen Y and Gen Z
Process researcher sketch icon vector. Hand drawn blue doodle line art process researcher sign. isolated symbol illustration
Demography infographic female avatars chart
Demography and infographic chart symbol collection

Population infographic. Men and women demographic statistics with pie charts, graphs, timelines. Demography data vector information. Gender and age percentage, world map with population
Chart icon set. business analytics, pie chart and growth trend symbol. infographic element and sign for web design

Z generation landing page illustration concept. Illustration for websites, landing pages, mobile applications, posters and banners.
Demography diagram icon. Vector illustration. EPS 10. Stock image.

Aatma Nirbhar Bharat means Self reliant India showing Indian flag during coronavirus pandemic time.
Growing bar graph and people icons for design of webpage template or mobile application

Vector infographic template with steps - flat design. Pie business chart, infographics.
Gray pie chart - business icon close-up. Four parts financial chart, infographic - flat vector illustration

Demographic man vs woman comparison concept for infographic template banner with big circle venn with line numbers with two point list information vector

Demographic man vs woman comparison concept for infographic template banner with big outline box circular with two point list information vector

Demographic man vs woman comparison concept for infographic template banner with round rectangle bar opposite with two point list information vector

Demographic man vs woman comparison concept for infographic template banner with big circle and small circle badge with two point list information vector

Demographic man vs woman comparison concept for infographic template banner with long rectangle box vertical with two point list information vector

India map and written Covid 19 Lockdown in papercut style and drop shadow. Stay home, Stay safe

India map and written Covid 19 Lockdown in papercut style and drop shadow. Stay home, Stay safe

Business and Marketing or Social Research Process, 8 Step of Research Methods on Old Antique Vintage Grunge Paper Texture Background
Business and Marketing or Social Research Process, 5 Step of Research Methods on Old Antique Vintage Grunge Paper Texture Background

Population and Demography, Illustration of Population Pyramids Chart or Age Structure Graph with Baby Boomers Generation, Gen X, Gen Y and Gen Z in 2016 to 2020.

Business and Marketing or Social Research Process, 5 Step of Qualitative Research Methods.

Business and Marketing or Social Research Process, Snowball Sampling Is A Non-Probability Sampling Technique in Qualitative Research.

Four Set of Snowball Samplings, The Non-Probability Sampling Technique in Qualitative Research Isolated on White Background
Population and Demography, Illustration of Population Pyramids Chart or Age Structure Graph with Baby Boomers Generation, Gen X, Gen Y and Gen Z in 2016 to 2020.

Population and Demography, Illustration of Population Pyramids Chart or Age Structure Graph with Baby Boomers Generation, Gen X, Gen Y and Gen Z in 2016 to 2020.
Business and Marketing or Social Research, The Process of Selecting Sample of Elements From Target Population to Conduct A Survey.

Crowded people vector speech bubble symbol.

Population and Demography, Population Pyramids Chart or Age Structure Graph with Baby Boomers Generation, Gen X, Gen Y and Gen Z in 2016 to 2020 on Old Antique Vintage Grunge Paper Texture Background.

Business and Marketing or Social Research Process, Illustration of The Process of Selecting Sample of Elements From Target Population to Conduct A Survey.

Business and Marketing or Social Research, The Process of Selecting Sample of Elements From Target Population to Conduct A Survey
Self dependent India with lion icon. Made in india stamp.

Business and Marketing or Social Research Process, Six Step of Research Methods on Old Antique Vintage Grunge Paper Texture Background

Human infographics.Retro vector template.

Opinion poll flat illustration of two groups of people and speech bubbles between them

Set of men and women cartoon characters at different aging stages. Human generation growth or evolution. Infant baby and child, young kid and teenager, mature adult and grandfather, grandmother. Age