


Filters

Stock vector images of Demografie
Discover royalty-free, professionally-designed vector art of Demografie for personal and commercial use.
People aging process from baby to elderly person 2 men women sets flat icons rows vector illustration
Flat design element. vector illustration

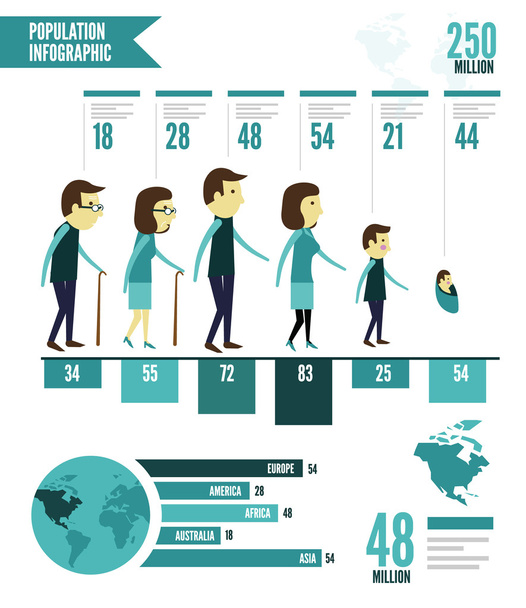
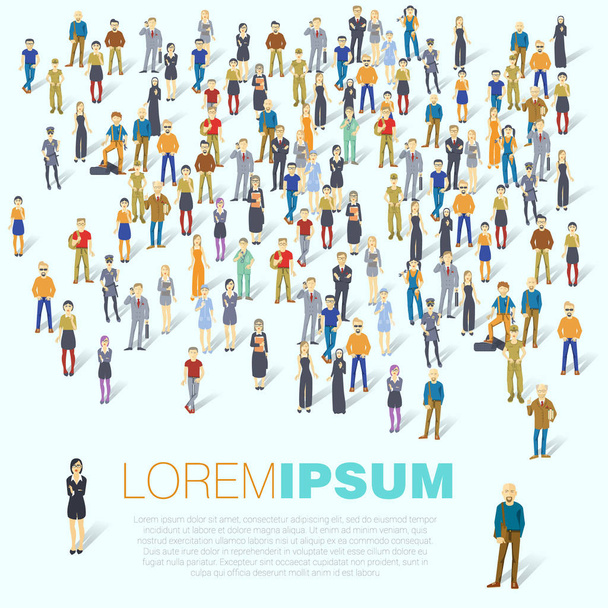
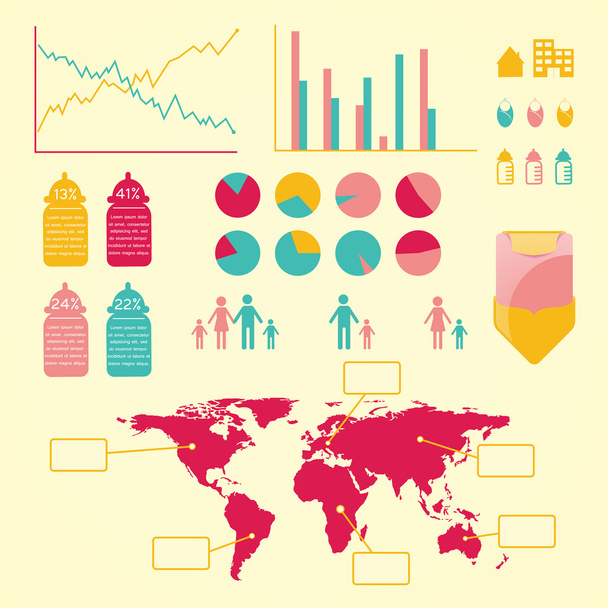
Human infographics. Vector template.

Human infographics. Vector seamless texture.

Population think over white background vector illustration

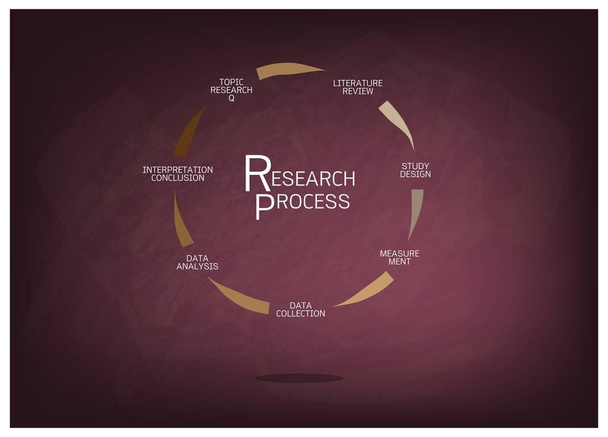
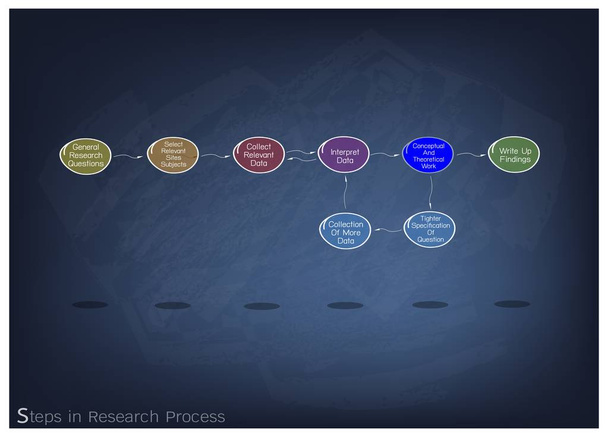
Business and Marketing or Social Research Process, Six Step of Research Methods on Black Chalkboard
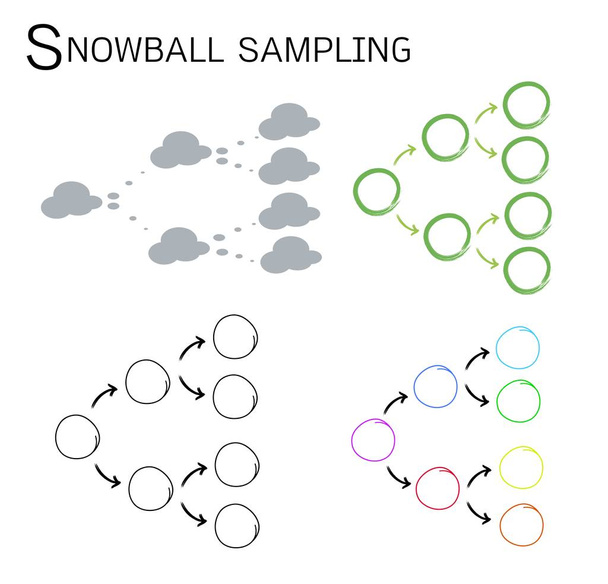
Four Set of Snowball Samplings, The Non-Probability Sampling Technique in Qualitative Research
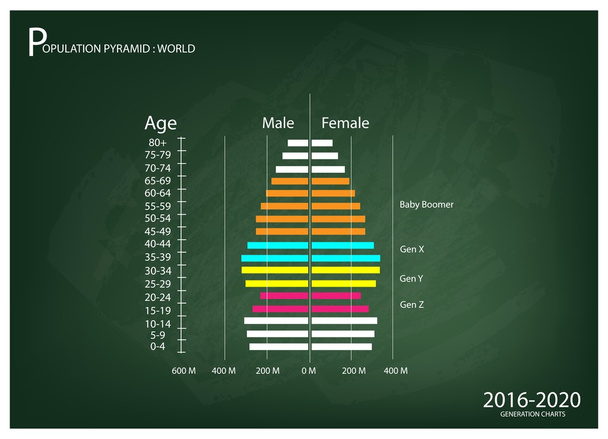
Population and Demography, Illustration of Population Pyramids Chart or Age Structure Graph with Baby Boomers Generation, Gen X, Gen Y and Gen Z in 2016 to 2020.
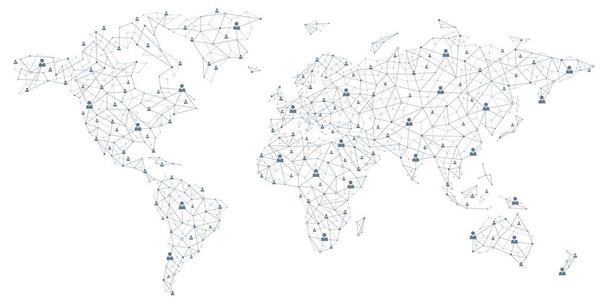
Vector World Map - Global Human Connection
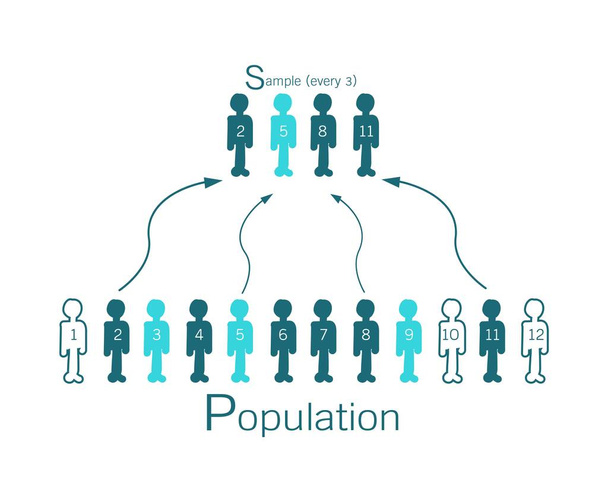
Business and Marketing or Social Research Process, The Sampling Methods of Selecting Sample of Elements From Target Population to Conduct A Survey
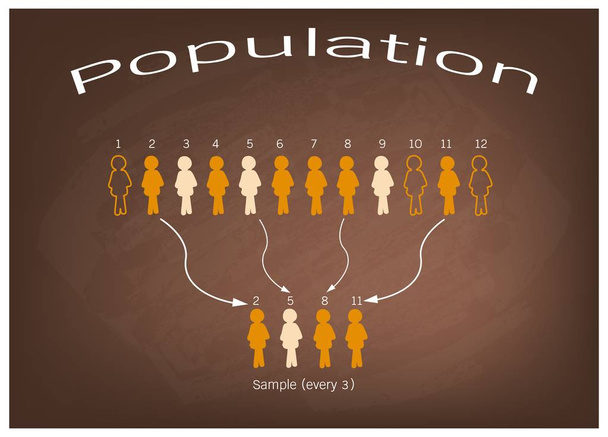
Business and Marketing or Social Research Process, The Sampling Methods of Selecting Sample of Elements From Target Population to Conduct A Survey on Brown Chalkboard.
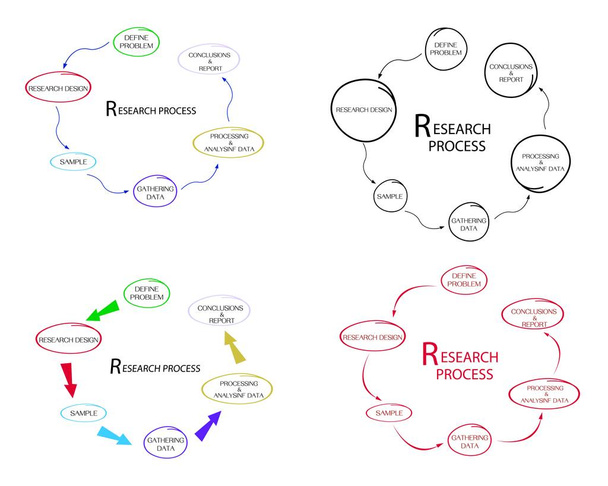
Business and Marketing or Social Research Process, 6 Step of Qualitative and Quantitative Research Methods.

Population and Demography, Illustration Set of 5 Types of Population Pyramids Chart or Age Structure Graph.
Diagram up icon

Vector illustration showing a crowd representing the population of France
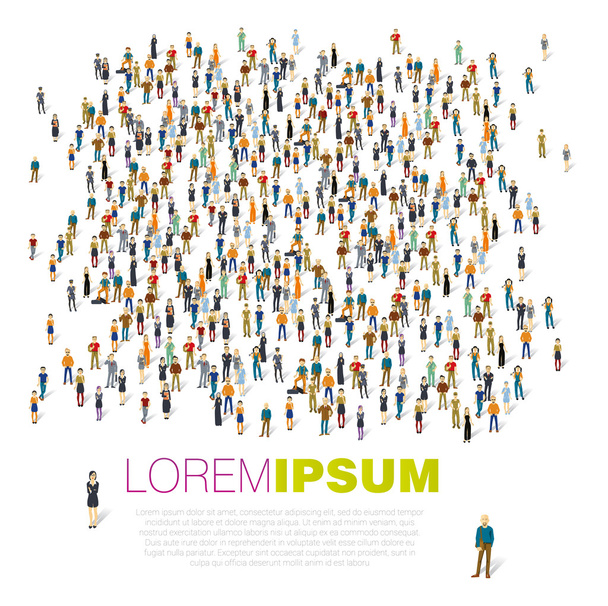
Human infographics. Vector template.

Vector World Map - Global Human Connection
Human social opinion infographic vector presentation template.

Set of isolated people in aging stages. Men generation growth. Infancy and childhood, puberty and adolescence, adult and maturity, old. Infant and teenager, father and grandfather.Demography evolution

Business and Marketing or Social Research, The Process of Selecting Sample of Elements From Target Population to Conduct A Survey
Business and Marketing or Social Research Process, Seven Step of Qualitative Research Methods on Chalkboard.
Business and Marketing or Social Research Process, 8 Step of Research Methods on Black Chalkboard.

Illustration - map of the world in vintage style.

Business and Marketing or Social Research Process, Data Collection Methods in Qualitative Measurement in Round Shape Chart on Black Chalkboard.

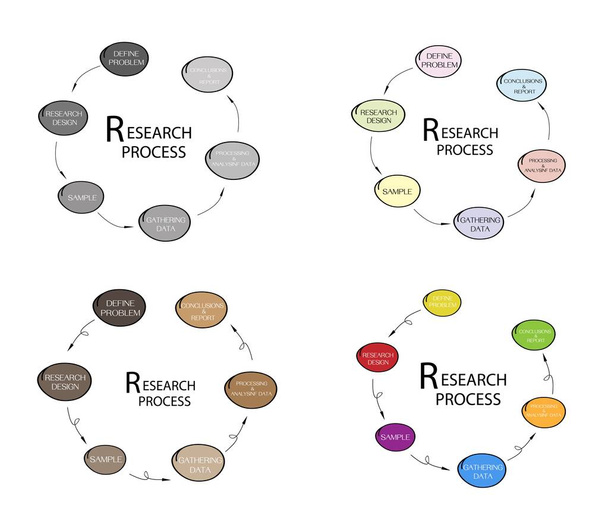
Round Shape Chart of Business and Marketing or Social Research Process in Qualitative and Quantitative Measurement.

Business and Marketing or Social Research Process, Classification of Sampling Methods The Probability and Non-Probability Sampling in Qualitative Research.

Business and Marketing or Social Research Process, The Sampling Methods of Selecting Sample of Elements From Target Population to Conduct A Survey.

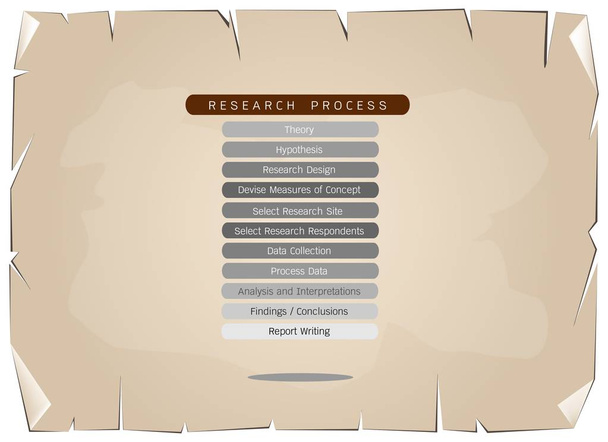
Business and Marketing or Social Research Process, The Sampling Methods of Selecting Sample of Elements From Target Population to Conduct A Survey on Old Antique Vintage Grunge Paper Background

Modern Information graphics vector for your ideas
Vector doodle diagram icon. Chart with columns of different size.

Business communication and teamwork infographics. Vector template.

Population and Demography, Illustration Paper Art Craft of 4 Types of Population Pyramid Charts or Age Structure Graphs
Business infographic concept illustration with icons and information text blocks for presentation, booklet, website and other design projects. Demographic creative banner. Colored layout.
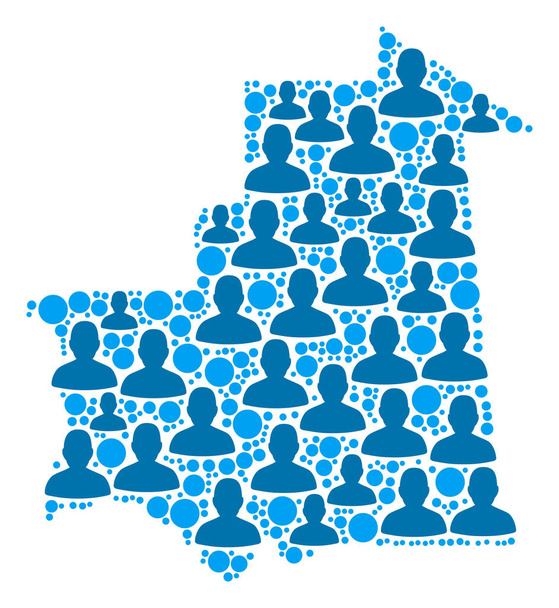
Population Mauritania map. Demography vector pattern of Mauritania map composed of randomized man items and spheric points. Abstract social scheme of nation community cartography.

Population Brazil map. Demography vector collage of Brazil map composed of crowd items. Abstract social representation of nation community cartography. Demographic map in blue color shades.

Population Iceland map. Demography vector pattern of Iceland map composed of men items. Abstract social scheme of national public cartography. Demographic map in blue color variations.

Population Republic of the Congo map. Demography vector concept of Republic of the Congo map created of man elements. Abstract social scheme of nation group cartography.

Population Koh Tao Thai Island map. Demography vector composition of Koh Tao Thai Island map combined of people items. Abstract social scheme of nation community cartography.

Population Christmas Island map. Demography vector collage of Christmas Island map constructed of man items. Abstract social representation of national community cartography.

Population Denmark map. Demography vector abstraction of Denmark map constructed of man elements. Abstract social plan of national mass cartography. Demographic map in blue color tinges.

Population Scandinavia map. Demography vector collage of Scandinavia map done of human elements. Abstract social scheme of nation group cartography. Demographic map in blue color tones.

Vector population Equatorial Guinea map. Demography abstraction of Equatorial Guinea map organized of men with variable poses. Demographic map in blue variations.
Vector illustration of infographic user icon element, statistic and hierarchy
Vector doodle diagram icon. Chart with columns of different size.
Business and Marketing or Social Research Process,Eleven Step of Research Methods on Old Antique Vintage Grunge Paper Texture Background

Population and Demography, Illustration of 4 Types of Population Pyramids Chart or Age Structure Graph on Old Antique Vintage Grunge Paper Texture Background

Business and Marketing or Social Research Process, 6 Step of Qualitative and Quantitative Research Methods on Old Antique Vintage Grunge Paper Texture Background

Human infographics. Vector template.
Diagram up icon
Diagram icon
Set Of 16 Board Icons. Includes Team Meeting, Report Demonstration, Conversation And Other Symbols. Beautiful Design Elements.

Big set of infographics elements. EPS10. Vector chart report template made from lines and icons
Market segmentation presentation template vector illustration with icons has 4 process such as Geographic, Psyhographic, Behavioral and Demographic. Marketing analytic for target strategy concepts.
Market segmentation presentation template vector illustration with icons has 4 process such as Geographic, Psyhographic, Behavioral and Demographic. Marketing analytic for target strategy concepts.

World population. Citizens in the world. White silhouettes of people on the planet earth in blue tones and on a black background
Demographic changes. Vector linear icon isolated on white background.
Two icons with figures of a man and a woman. Vector design of gender symbols icons

Vector population map of the Federative Republic of Brazil
Business researcher sketch icon vector. Hand drawn blue doodle line art business researcher sign. isolated symbol illustration
Science researcher neon light sign vector. Glowing bright icon science researcher sign. transparent symbol illustration
Strategy researcher neon light sign vector. Glowing bright icon strategy researcher sign. transparent symbol illustration
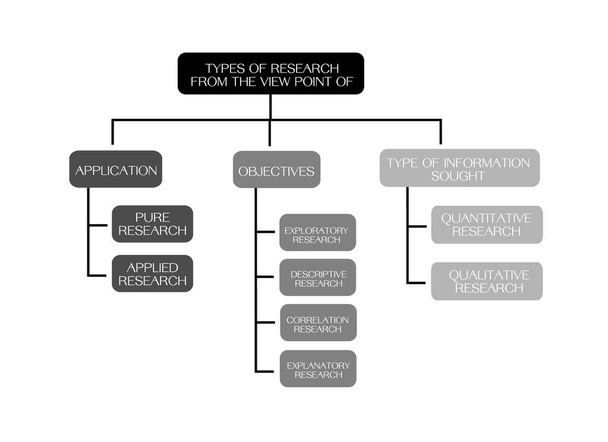
Research Process and Methods, Type of Research From Application, Objectives and Information Sought Isolated on White Background

Business and Marketing or Social Research Process, The Sampling Methods of Selecting Sample of Elements From Target Population to Conduct A Survey

Business and Marketing or Social Research Process, 5 Step of Qualitative and Quantitative Research Methods Isolated on White Background

Business and Marketing or Social Research Process, 11 Step of Qualitative and Quantitative Research Methods Isolated on White Background

Population and Demography, Population Pyramids Chart or Age Structure Graph with Baby Boomers Generation, Gen X, Gen Y, Gen Z and Gen Alpha in 2021 to 2025 on Old Antique Vintage Grunge Paper Texture Background.
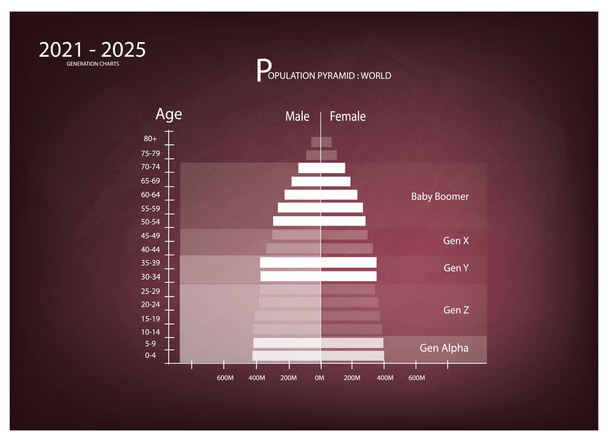
Population and Demography, Population Pyramids Chart or Age Structure Graph with Baby Boomers Generation, Gen X, Gen Y, Gen Z and Gen Alpha in 2021 to 2025 on Chalkboard Background.

Population percentage people flat icon

Researcher Business Seamless Pattern Vector Thin Line. Illustrations

Vector Illustration For 2020 Population Census. Digital Concept With Survey And Check. Can Use For Landing Page, Template, Web, Mobile App, Poster, Banner, Flyer, Background, Website, Advertisement
Demography Diagram Icon vector illustration
Population growth icon, increase social development, global demography. Vector illustration. Stock picture. EPS 10.

3D Isometric Flat Vector Set of Demography Elements, Population Infographic
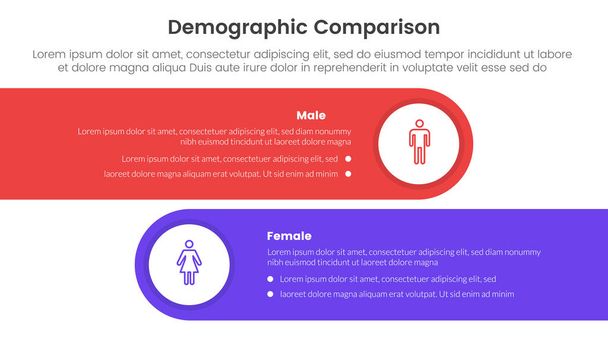
Demographic man vs woman comparison concept for infographic template banner with horizontal round rectangle box with two point list information vector

Demographic man vs woman comparison concept for infographic template banner with big line arrow opposite with two point list information vector
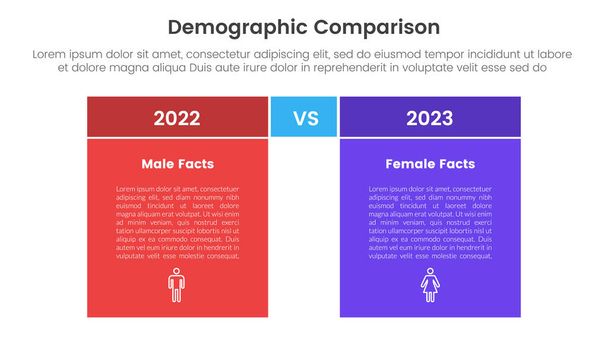
Demographic man vs woman comparison concept for infographic template banner with box table with fullcolor background block with two point list information vector
Made in India with Self dependent bharat stamp.

Gray Vector Pie Chart Infographic Steps - Flat Design.
Collection of infographic elements. Business icons for presentation, statistics and analytics. Competitive work. Variety of round charts

VECTOR ILLUSTRATION SHOWS THE TEXT AATMA NIRBHAR BHARAT MEANS "SELF DEPENDENT INDIA" HAVING THE INDIAN MAP AND THE FLAG COLOURS IN THE BACKGROUNG ALONG WITH THE FIRE LIGHT SHOWING THE CONSISTENCY TO FOLLOW THE SLOGAN.
Family flat line icon. Vector outline illustration of male ,female and kid. Black thin linear pictogram for adult people.
Hand drawn doodle population growth icon chart and graph illustration vector isolated

Contemporary abstract artwork. Woman with red hair and blue coat stands with closed eyes, and seems to be lost in thought. Vector illustration in surrealistic art style. Concept of gen Z, culture.

Population and Demography, Illustration of Population Pyramids Chart or Age Structure Graph with Baby Boomers Generation, Gen X, Gen Y and Gen Z in 2016 to 2020.

Illustration representing a stone age family
Global birht info graphic with statistics and graphs
Market segmentation Infographic 10 steps UI design.demography, segment, Benchmarking, Age group simple icons

Vector seamless pattern, profile, Editable can be used for web page backgrounds, pattern fills
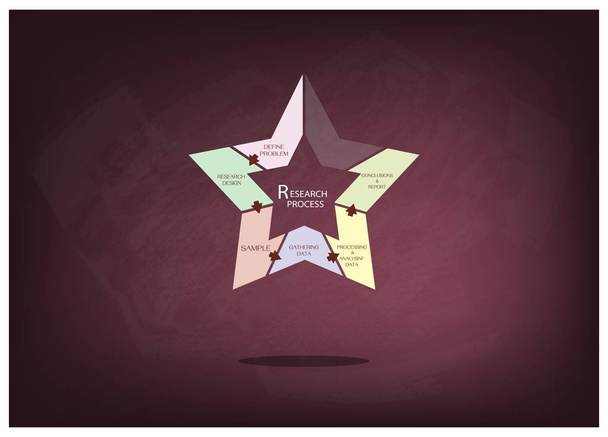
Star Shape Chart of Business and Marketing or Social Research Process in Qualitative and Quantitative Measurement on Chalkboard.

Business and Marketing or Social Research Process, The Sampling Methods of Selecting Sample of Elements From Target Population to Conduct A Survey
Business and Marketing or Social Research Process, Six Step of Qualitative and Quantitative Research Methods.

Business and Marketing or Social Research Process, Six Step of Research Methods on Old Antique Vintage Grunge Paper Texture Background

Population and Demography, Population Pyramids Chart or Age Structure Graph with Baby Boomers Generation, Gen X, Gen Y, Gen Z and Gen Alpha in 2021 to 2025 on Chalkboard Background.
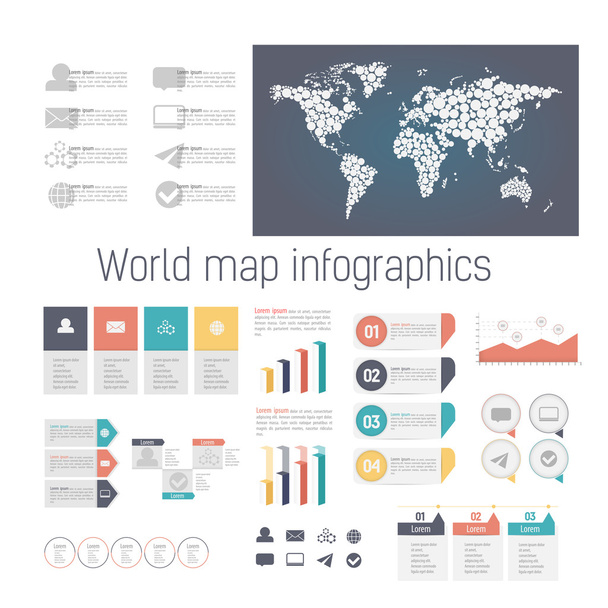
Set of colored infographics color elements. Detail infographic vector illustration. World Map and Information Graphics.

Big set of infographics elements. EPS10. Vector chart report template made from lines and icons

Business and Marketing or Social Research Process, Snowball Sampling Is A Non-Probability Sampling Technique in Qualitative Research on Black Chalkboard

Infographic elements great for presentations, reports, prints, brochures, websites etc. The file is created in order to be used by everyone (editable colors, text, shapes etc.). All the charts and graphs are sliced into pieces of 5 percent each.

VECTOR ILLUSTRATION FOR SELF DEPENDENT INDIA. ILLUSTRATION SHOWS THE TEXT AATMA NIRBHAR BHARAT MEANS "SELF DEPENDENT INDIA" HAVING THE INDIAN MAP WITH THE FLAG COLOURS IN THE BACKGROUND AND HANDS IN THE BACKGROUND SHOWING UNITY TO FOLLOW THE SLOGAN.

Illustration - map of the world with some landmarks.

Population Oklahoma State map. Demography vector collage of Oklahoma State map done of random man items and small dots. Abstract social scheme of national public cartography.